Last topic: Designing DB for a purchasing System. 1st step: ERD
I designed the ERD of a purchasing website, I described the tables and their attributes
Now I’ll design the DFD(Data Flow Diagram) of the system. But First, let me show you how does it looks like and how you can move from page to another, so you choose the item you look for.
@Home page:
You will see all types we have in our shop, when you move over one of the types. The categories of that type will be loaded in the same page. When you choose one of these categories, you will move to the subcategories page that list its subcategories. But if the chosen category has only one subcategory, you’ll be directed to the Items page that contains all items of the subcategory.(i.e you’ll not move to subcategories page)
EX. If you chose Computer Science category that’s dropped from Books Type, you’ll be directed to Subcategories page. But if you chose HP category that’s dropped from Laptop type, you’ll be directed to the Items page directly without passing to subdirectories page. Because HP category has only one subcategory that has all items, so there is no need for moving to subcategories.
At home page you can choose one of the best sellers, then you’ll move to the itemDetails page.
Also you can search for specific item, if there are results, they will be displayed at items page.
You can sign in, and then all price items will be displayed with the equivalent currency of your country.
You can make a new registration.
@Subcategories page:
You’ll be directed to this page after choosing a category from Home page, all subcategories of the chosen categories will be placed inside here.
In the left corner, there are all of the categories that dropped from the type you chose except the category you browse its subcategories now. Here the other categories of Books type.
You can choose one of the categories in the left corner. If that category has more than one subcategory, then its subcategories will be displayed in the right side of the same page. But if that category has only one subcategory, then the items of that subcategory will be displayed in the Items page.
Items Page
@Items page:
You can select any item or its related items to browse their details; also you can add this item directly to the cart
@Itemdetails page:
you can explore the item details then add to cart or back to choose another item
@Buy page:
you’ll see all item you had chosen and total price. Also you can remove some of these items or back to choose extra items. Now you can buy the selected items. If you agree you will directed to another page to type your secret information such name and credit card. The page will connect to bank and check your info. If true, you’ll finish buying. If not, you will be notified.
*******************************************
Now, let’s move to the DFD.
system analyst draws DFDs to better understand the logical movement of data throughout a business. Data flow diagrams are structured analysis and design tools that
allow the analyst to comprehend the system and subsystems visually as a set of interrelated data.
Four basic symbols are used to chart data movement on DFDs :
Square: This is used to depict an external entity (another department, a
business, a person, or a machine) that can send data to or receive data from the system.
Entities should be named with a noun.
Rectangle with rounded corners: This is used to show the occurrence of a transforming
process. Process always denotes a change in or transformation of data.
Process assigns the name of whole system or a major subsystem. Use a verb-adjectivenoun
format for detailed processes.
Rectangle: which represents a data store. The data store symbol is simply
showing a depository for data that allows addition and retrieval of data. Each data store has
a unique reference number such as D1, D2, and so on to describe its level.
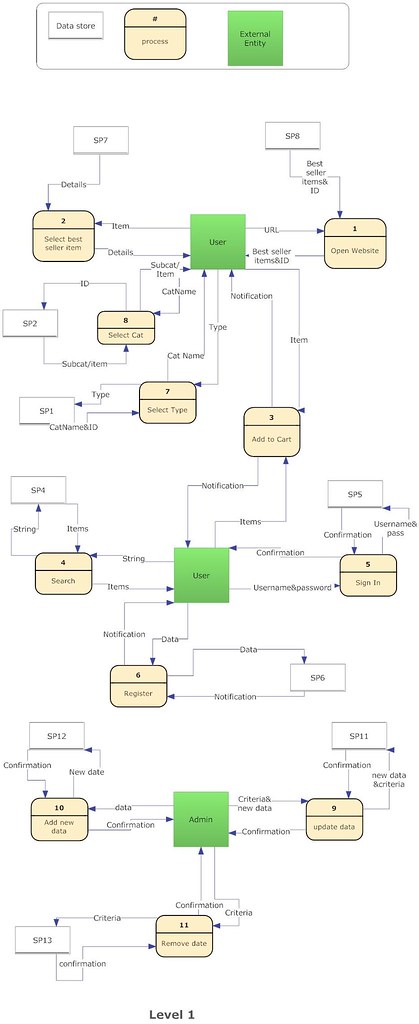
But here I used the SP1,SP2,SP3, and so on. Because I used stored procedures to deal with data. I used SP instead of D in the diagram to make it easy to understand. So instead of connecting with D1, D2 to retrieve items of subcategory, I’ll use only SP3.
Here are the used stored procedures:
SP1 GetCatOfType: return all categories of selected type.
SP2 CheckIfThereSubCat: check if there are more than one subcategory. If so, it return all subcategories of selected category. If there only one subcategory, it call SP3 to return the items of that subcategory.
SP3 Get ItemsOfSubCat: return all items of selected subcategory.
SP4 Search : used for searching for specific item.(I supposed the search process use this SP)
SP5 CheckValidUser: check the existence, the validity and his desire for changing price with his currency.
SP6 InsNewUser: used for registering new user.
SP7 GetItemDetails: check the type of the item, then connect with the suitable table to return the details.
SP8 GetBestSellers: return the best seller items
SP10 DelItem: used by the admin to remove any item
SP11 Updatedata: used by the admin to update any item
SP12: AddNewDate: used by admin to add new data
The arrow: that shows movement of data from one point to another, with the head of the
arrow pointing tow ards the data’s destination. A rrow s should be described w ith a noun.
Data Flow Diagram Levels:

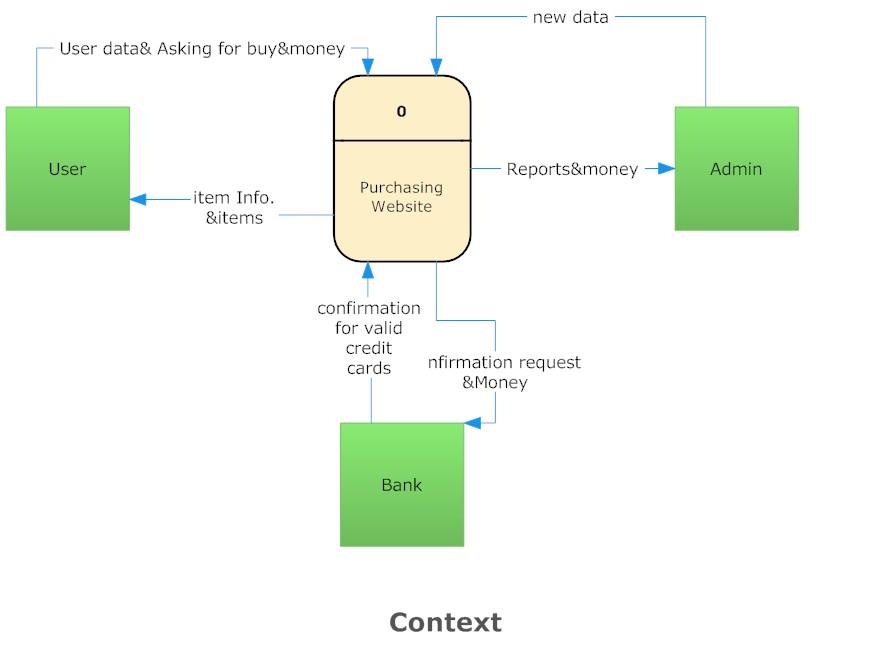
The context diagram is the highest level in a data flow diagram and contains only one process, representing the entire system. The process is given the number zero. All external entities are shown on the context diagram as well as major data flow to and from the system. The diagram donot show any detailed processes or data stores.

Level1 is the explosion of the context diagram. Each process is numbered with an integer.

**********************************

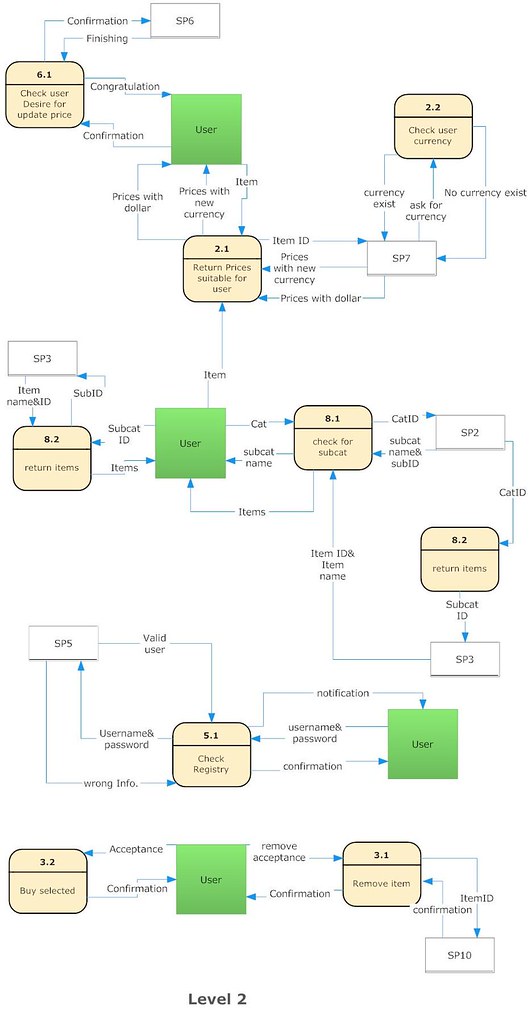
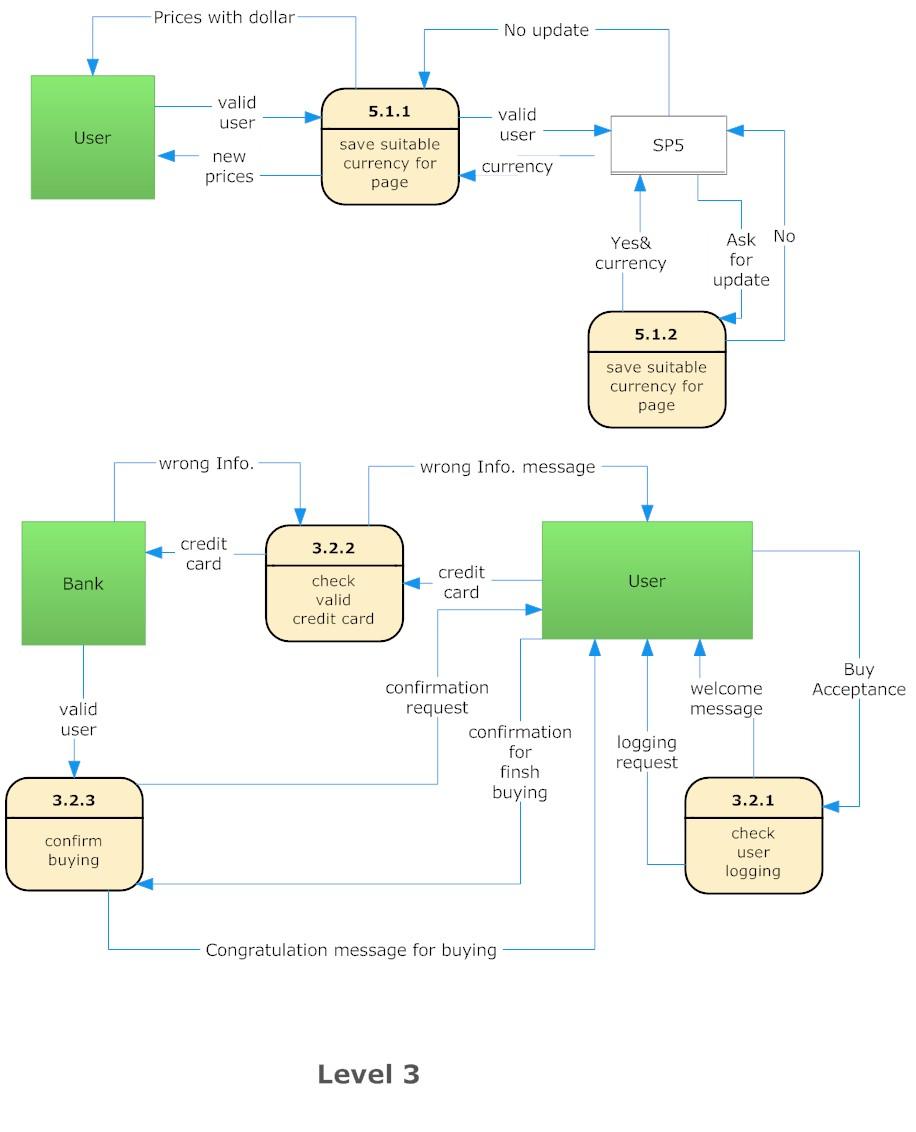
Child Levels: Some processes on level1 may in turn be exploded to create a more detailed child diagram. The process on Diagram1 that is exploded is called the parent process, and the diagram that result is called child diagram. The processes or the child diagram are numbered using the parent process number, a decimal point, and a unique number for each child process. For example: Process 3 explode (in level 2) to create two processes 3.1 and 3.2. Process 3.2 explode(in level 3) to create three processes 3.2.1, 3.2.2 and 3.2.3 .
Here’s the Image URL:
Context: http://farm3.static.flickr.com/2011/1577378989_8faa037a42_o.jpg
Level 1: http://farm3.static.flickr.com/2108/1577379021_10126f013d_b.jpg
Level 2: http://farm3.static.flickr.com/2040/1578318110_2967c04610_b.jpg
Level 3: http://farm3.static.flickr.com/2273/1578318116_7caa88cbf6_o.jpg
Amira

I need a sample DFD on a dynamic website would you pls send me
Comment by Abuki — May 2, 2010 @ 10:03 am
Can you plz help me for a dfd for an ecommerce website, a bit different from the one you placed here
Comment by samia — February 11, 2011 @ 4:39 pm
plz help me i want to design pechasing system for any company or insititute ( not specific ).it is my assignment
Comment by javaria — May 24, 2011 @ 6:17 am
yes i also need what abuki needs
Comment by sparrow — July 27, 2011 @ 6:48 am
this dfd has alot of errors
Comment by Anonymous — May 3, 2012 @ 1:29 am
That are awsame
Comment by Anonymous — August 23, 2012 @ 2:55 pm
I am actually thankful to the owner of this web site who has shared this great post
at at this place.
Comment by Bertha — January 19, 2013 @ 5:49 pm
Great blog here! Also your web site loads up fast!
What host are you using? Can I get your affiliate link to your host?
I wish my website loaded up as quickly as yours lol
Comment by david-laserscanner.Jp — January 19, 2013 @ 10:47 pm
With havin so much content do you ever run into any issues of plagorism or copyright infringement?
My website has a lot of unique content I’ve either created myself or outsourced but it seems a lot of it is popping it up all over the internet without my authorization. Do you know any solutions to help prevent content from being ripped off? I’d really appreciate it.
Comment by window service in lasalle — February 12, 2013 @ 6:35 pm
Your style is unique in comparison to other people I have read stuff from.
Thanks for posting when you’ve got the opportunity, Guess I will just bookmark this web site.
Comment by order dumpster — February 17, 2013 @ 12:17 pm
very nice sir,I am thankful to the owner of this web site who has shared this great post
at at this place.
Comment by Anonymous — March 8, 2013 @ 6:08 am
Greetings! I’ve been reading your website for some time now and finally got the courage to go ahead and give you a shout out from New Caney Texas! Just wanted to say keep up the great work!
Comment by zastaw na nieruchomości — May 2, 2013 @ 11:02 pm
Touche. Sound arguments. Keep up the amazing work.
Comment by www.lagoario.com — May 5, 2013 @ 6:23 pm
It really is accurate that all the details that we get on internet can not be trusted constantly.
But i believe what you say is far more trsutworthy regarding the subject.
Comment by Six Pack Abs Shortcuts Free Download — May 6, 2013 @ 10:44 pm
Thank you 🙂
Comment by coolbutfine — May 17, 2013 @ 1:16 pm
I almost never comment, but after looking at some of the comments here Data Flow
Diagram(DFD) for a Purchasing Website. | Notes eMeroo(Some TechTips);.
I do have a couple of questions for you if you do not mind.
Is it only me or does it look as if like some of these remarks come across like they are written by brain
dead folks? 😛 And, if you are posting at additional places,
I would like to keep up with everything fresh you have to post.
Could you list of every one of your shared pages like your linkedin
profile, Facebook page or twitter feed?
Comment by free ways to attract women — July 2, 2013 @ 12:22 am